|

|
|
|
|
|
|
|
|
|
|
|
|
|
|
|
|
|
|
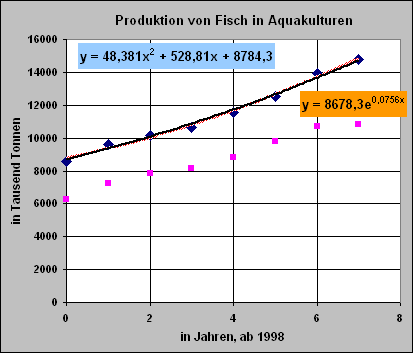
in Jahren |
|
0 |
1 |
2 |
3 |
4 |
5 |
6 |
7 |
|
|
Land |
|
1998 |
1999 |
2000 |
2001 |
2002 |
2003 |
2004 |
2005 |
|
|
World |
Q |
8598 |
9623 |
10182 |
10627 |
11576 |
12527 |
13931 |
14790 |
|
|
total |
W |
5393847 |
5710606 |
5609186 |
5702024 |
6172056 |
6352993 |
6809424 |
7118391 |
|
|
China |
Q |
6277 |
7254 |
7864 |
8159 |
8809 |
9802 |
10715 |
10855 |
|
|
|
W |
3733059 |
3935544 |
3999906 |
4090710 |
4398707 |
4776016 |
5127645 |
5245454 |
|
|
Philip- |
Q |
685336 |
696112 |
707039 |
785795 |
894857 |
988889 |
1204808 |
1338597 |
|
|
pines |
W |
45653 |
63376 |
53290 |
58019 |
62669 |
67678 |
93858 |
109807 |
|
|
Indo- |
Q |
117210 |
133720 |
205227 |
212473 |
223080 |
231900 |
410570 |
910636 |
|
|
nesia |
W |
14065 |
16046 |
22575 |
21247 |
36636 |
? |
? |
? |
|
|
Japan |
Q |
523674 |
556037 |
528881 |
511448 |
557951 |
477705 |
484389 |
507742 |
|
|
France |
Q |
60 |
32 |
32 |
35 |
38 |
37 |
37 |
45 |
|
|
Namibia |
Q |
17 |
20 |
20 |
20 |
38 |
67 |
67 |
67 |
|
|
|
W |
7 |
8 |
9 |
10 |
35 |
62 |
62 |
62 |
|
|
|
|
|
|
|
|
|
|
Jahr |
nach J |
quadr. |
expon. |
|
|
2006 |
8 |
16111,16 |
15824,26 |
|
|
2007 |
9 |
17462,45 |
17058,25 |
|
|
2008 |
10 |
18910,5 |
18388,47 |
|
|
2009 |
11 |
20455,31 |
19822,42 |
|
|
2010 |
12 |
22096,88 |
21368,2 |
|
|
2011 |
13 |
23835,22 |
23034,51 |
|
|
2012 |
14 |
25670,32 |
24830,76 |
|
|
2013 |
15 |
27602,18 |
26767,09 |
|
|
2014 |
16 |
29630,8 |
28854,41 |
|
|
2015 |
17 |
31756,18 |
31104,51 |
|
|
2016 |
18 |
33978,32 |
33530,07 |
|
|
|
|
|
|
|
|
|
|
|
|
|
|
|
|
|
|
|
|
|
|
|
|